Python x Excel
You can always refer to this LinkedIn Learning Video Using Pythion with Excel.
Install Python Interpreter
Interpreter in computer are necessary in every programming, like it’s name, it “translate“ our human readable code into 0 and 1 computer readable “language“.
Download the newest Python interpreter from python.org.
Run .exe file, use default download options.
You need a Python IDE (Integrated Development Environment) or a code editor to write code. Recommended using IDE.
- Windows OS: JetBrains PyCharm, VS Code
- MacOS: JetBrains PyCharm, VS Code, Komodo, Atom
Python “Pandas” Basic
Pandas library - primarily used in data science, provide Python function, statement that make Excel sorting, examining and modifying very easy.
You can always refer to Pandas Official API Document, and Pandas Official User Guide.
Install Pandas
- Open command prompt:
- Install Python Pandas: in command prompt type
py -m pip install pandas - Import Pandas: in command prompt
py, thenimport pandas
Import “Pandas”
Import Pandas library that we can use it’s function and statement. For example the one we used next step pd.read_csv.
1 | import pandas as pd |
Loading and saving data
Lode excel and txt data into Python data frame to be able to work on it.
1 | df_excel = pd.read_excel('regions.xlsx') # upload Excel file; |
dfshort for Data Frame- Use
.read_csvfor both.csvand.txtfile, because.csvand.txtare very similar in terms how they column their data.
Save as the modified file into a new Excel file. The saving step will be omitted in subsequent presentations.
1 | df_csv.to.excel('modified.xlsx') |
Python “Pandas” in practices
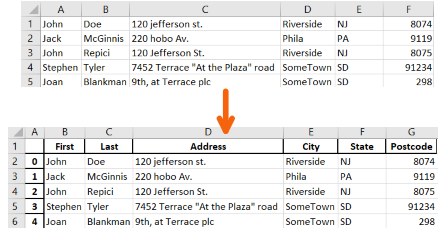
Add header for data sheet
1 | df_csv = pd.read_csv('Names.csv', header=None) # load csv file |
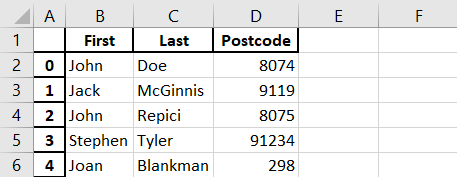
View number of column selectively
1 | df = pd.read_csv('Names.csv', header=None) # load csv file |
wanted_values- select the columns want to showdf.drop- select the columns don’t want to show
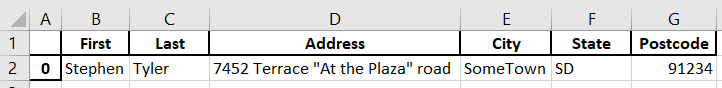
Filter data
This case we want to filter the data with First name Stephen who live in SomeTown.
1 | df = pd.read_csv('Names.csv', header=None) # load csv file |
Filter judgment has tow part
(df['City'] == 'SomeTown')- find all ‘SomeTown’ in ‘City’ column(df['First'] == 'Stephen')- find all ‘Stephen’ in ‘First’ column
Apply Logical expression on data
Apply filter using one line of code of if()...else... function, and store output in a new named column.
To do the same thing, Microsoft Excel requre more effort, time and understand.
You need select “Sort and filter” –> “customer sort” –> select data range –> select output range –> define logical filter …
1 | df = pd.read_csv('Names.csv', header=None) # load csv file |
df[‘Tax %’]` - create a new column call ‘Tax %’, and store calculate value for each people/unit.
df['Income'].apply(...)- with ‘Income’, apply following function …lambda x- x represent different ‘Income’ for each people/unit.15 if 10000<x<40000- output 15% if ‘Income’ is between 10000 ~ 40000else .2 40000<x<80000- output 20% if ‘Income’ is between 40001 ~ 80000else .25- output 25% beyond 80000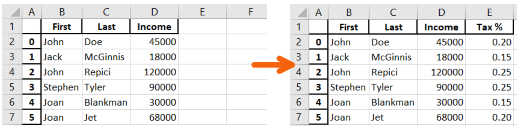
Calculate data
Simple calculation, one column multiple other column and create a new column to save the output.
1 | df = pd.read_csv('Names.csv', header=None) # load csv file |

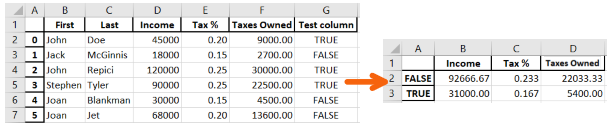
Simple Classification data analysis
We classification/grouping according to “Test column”, which is “True” and “False”, and calculate the mean value for “Income”, “Tax %” and “Taxes Owned”.
1 | df = pd.read_csv('Names.csv', header=None) # load csv file |